banner

Crea vídeos de estadísticas online gratis

Mostra estadísticas a través de un video es la manera más directa de presentar los datos y perspectivas de forma visual. El creador de videos de estadísticas en línea de FlexClip hace que el proceso sea muy fácil al proporcionar todo lo que necesitas para crear un video de estadísticas digno de compartir. Selecciona entre plantillas profesionales, abundante material multimedia, herramientas de edición potentes, etc., y crea un video de estadísticas convincente a tu disposición. ¡Pruébalo gratis!

Crea un vídeo gratis
  • Práctico editor de vídeoiconPráctico editor de vídeo
  • Riqueza de plantillas de vídeosiconRiqueza de plantillas de vídeos
  • Amplia biblioteca multimediaiconAmplia biblioteca multimedia
  • Animaciones de texto dinámicasiconAnimaciones de texto dinámicas
  • Trusted by:
  • microsoft-logo
  • google-logo
  • dropbox-logo
  • youtube-logo
  • unsplash-logo
  • storyblocks-logo

Plantillas de vídeos de estadísticas profesionales gratuitas

  • Muestra Informe Empresa Moderna
    Personalizar
    Crear IA

    Muestra Informe Empresa Moderna

  • Investigación Informe Presentación
    Personalizar
    Crear IA

    Investigación Informe Presentación

  • Reporte De Negocios
    Personalizar
    Crear IA

    Reporte De Negocios

  • Profesional Anual Compañía Informe Negocio Video
    Personalizar
    Crear IA

    Profesional Anual Compañía Informe Negocio Video

  • Negocio Simple Proyecto Informe
    Personalizar
    Crear IA

    Negocio Simple Proyecto Informe

  • Informe Del Primer Trimestre
    Personalizar
    Crear IA

    Informe Del Primer Trimestre

  • Copa Del Mundo De Fútbol   Partido   Equipo   PK   YouTube   Introducción
    Personalizar
    Crear IA

    Copa Del Mundo De Fútbol Partido Equipo PK YouTube Introducción

  • Estilo Tecnología Big Data Impacto Lista
    Personalizar
    Crear IA

    Estilo Tecnología Big Data Impacto Lista

  • Corporativo Empresa Negocio Informe Anual
    Personalizar
    Crear IA

    Corporativo Empresa Negocio Informe Anual

  • Azul Naranja 3d Informe Comercial
    Personalizar
    Crear IA

    Azul Naranja 3d Informe Comercial

  • Presentación Informe Trimestral De Negocios
    Personalizar
    Crear IA

    Presentación Informe Trimestral De Negocios

  • Reporte De Ventas
    Personalizar
    Crear IA

    Reporte De Ventas

Vídeo De Estadísticas para Edición Gratuita
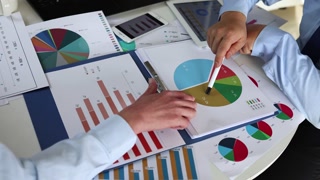
Financial Data Comparison And Analysis Research
Close up of business woman holding clipboard with graphics and financial statistics working overtime in front of computer sitting in start-up business office. Busy employee using modern technology
Economic inflation rise in interest rates financial graph percentage statistics
Big data statistic patterns and trends cloud computing analysis graphs and chart
Following Shot of the Confident Businessman in a Suit Walking Through His Office and Looking out of the Window Thoughtfully. Stylish Modern Business Office with Personal Computer and Big City View.
3d Screen Of Business Growth Stats Bars
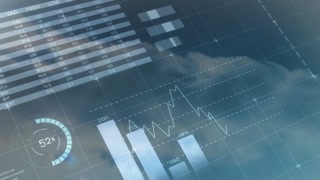
3D animation of growing histogram. Hi tech charts with grid. Digital display with stock market charts. Camera movement with depth of field
education, high school, university, teaching and people concept - group of international students and teacher or lecturer showing scheme on white board in lecture hall
Female chief analyst holding meeting with four businesswmen showing digital interactive whiteboard with charts, data and statistics at briefing table in office
Female hand going over financial documents with charts and tables. Closeup shot.
Bar chart icon with an upward trend representing the concept of Statistics
Pie Rising bars graph, Financial graph analysis. Full HD. 4K
Financial data and stock market trends animation over people working in office
Business concept where likable confident positive professional international team of specialists consulting about economic indicators depikted on tv screen in evening office
business, corporate and people concept - businessman and businesswomen with charts at office meeting
Graphs and Charts
Business graphs and charts
Graph chart diagram
Seamless pattern background with dollar signs. animation. small, black dollar signs slowly blink on grid. Perfect to use in presentation. Can put your text, charts, graphs in it.
statistics infographic bars data animation
Graph chart diagram
White background with Orange and black circles descend and rise in different directions in abstraction.
Professional is engaged in planning working with charts and graphs
Mentioning demographic shift in media headlines

Por qué necesitas crear un vídeo de estadísticas

  • Promo Video

    Comparte momentos

    Crear una historia en vídeo es una gran manera de compartir tus momentos importantes con tus familiares y amigos.

  • Promo Video

    Evoca emociones

    Un vídeo puede transmitir una fuerte emoción y conectar con el público.

  • Promo Video

    Aumenta la participación

    La gente es más propensa a participar, compartir y comentar en el contenido en vídeo.

Cómo crear un vídeo de estadísticas en 3 pasos

  1. 1

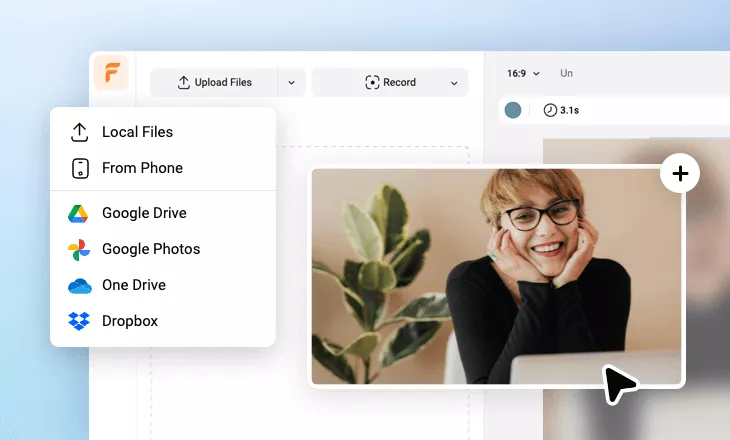
    Añade medios

    Añade vídeos o fotos desde tu ordenador o desde bibliotecas de archivo al guión gráfico.

  2. 2

    Personaliza

    Añade texto, música y voz en off para personalizar tu vídeo de estadísticas.

  3. 3

    Exporta

    Descarga tu vídeo de estadísticas en varias relaciones de aspecto y definiciones o compártelo online con el mundo.

Cómo crear un vídeo de estadísticas en 3 pasos

Temas Relacionados

Editor thumbnail
Crea un vídeo de estadísticas gratis en minutos
Crea un vídeo gratis